Understanding Support & Resistance: A Beginner's Guide
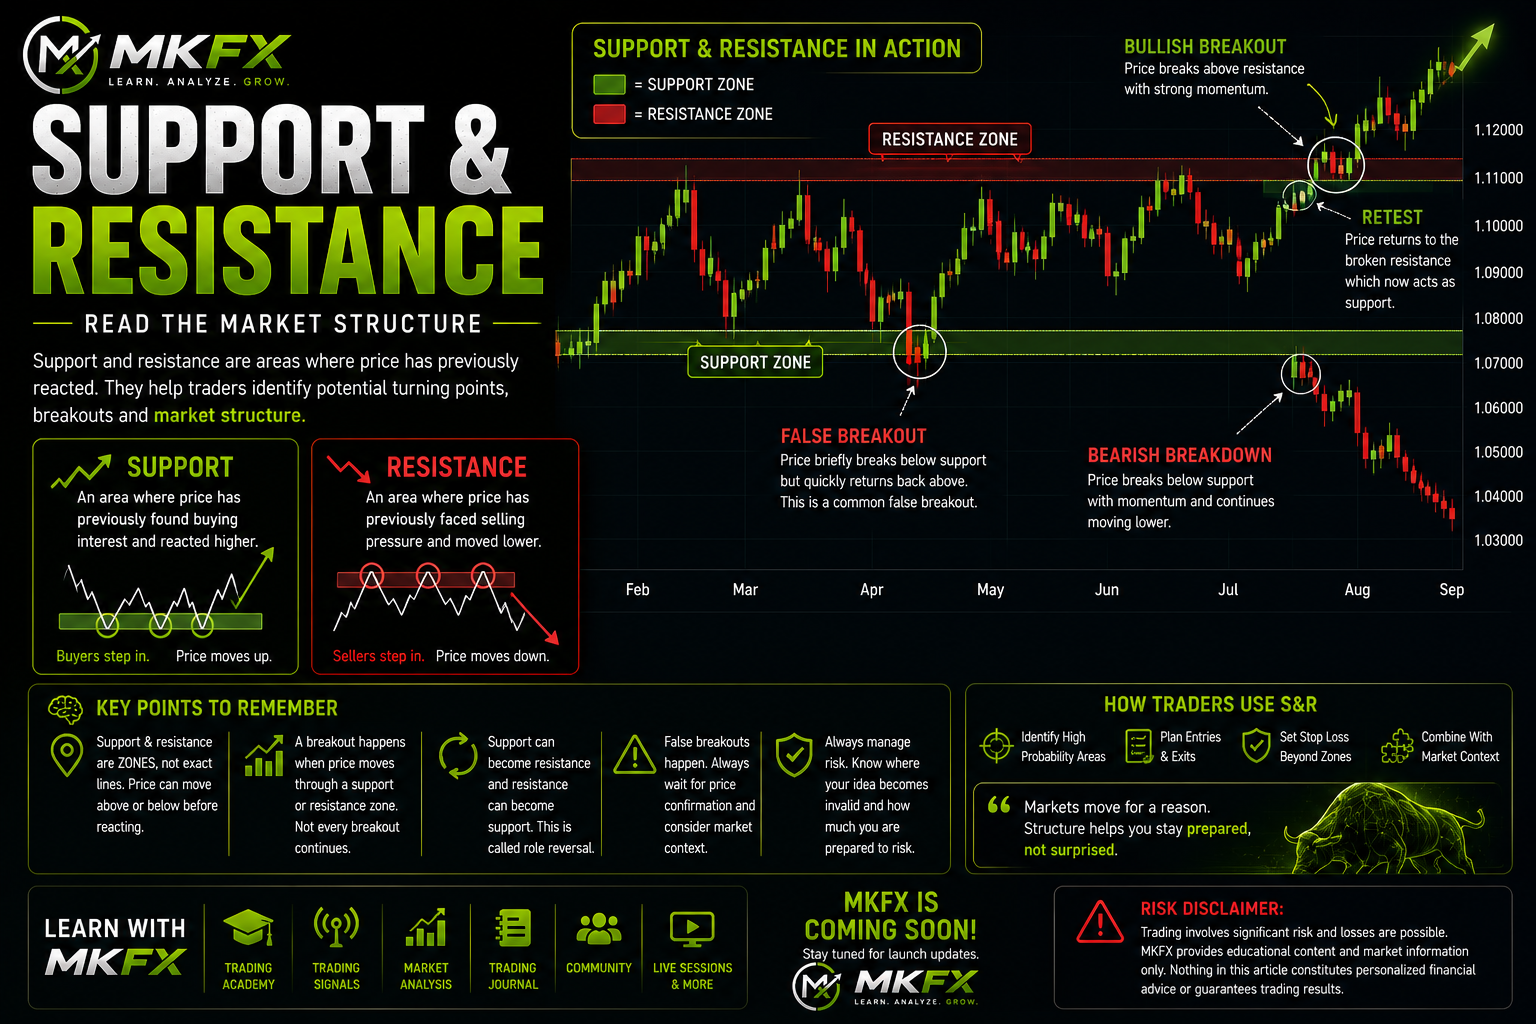
Support and resistance are two of the most important concepts traders encounter when learning technical analysis.
They represent areas on a chart where price has previously reacted or where buying and selling pressure may become significant.
Understanding these areas can help traders read market structure, identify areas of interest and develop more structured trading decisions.
However, support and resistance should never be treated as guaranteed turning points.
What Is Support?
Support is an area where falling price has previously experienced increased buying interest or difficulty continuing lower.
Imagine price moving downward before slowing, stopping and eventually moving higher.
If price returns to that area later, traders may watch to see whether buyers respond again.
Support should generally be viewed as an area or zone rather than one perfect price.
A previous reaction does not guarantee that the same support area will hold again in the future.
What Is Resistance?
Resistance works in the opposite direction.
It is an area where rising price has previously experienced increased selling pressure or difficulty continuing higher.
Price may approach the area, struggle to continue upward and then move lower.
If price returns to the same area, traders may watch how the market reacts.
Just like support, resistance should generally be treated as a zone rather than an exact price.
How Can Support and Resistance Be Identified?
Traders commonly look for areas where price has reacted previously or where market activity appears significant.
These may include:
- Previous swing highs
- Previous swing lows
- Areas with repeated price rejection
- Previous consolidation areas
- Important psychological price levels
- Previous breakout areas
- Areas where price changed direction strongly
Areas that are clearly visible on a chart may receive increased attention from market participants.
However, the number of previous reactions alone does not guarantee that an area will continue to hold.
Support and Resistance Are Zones
One common beginner mistake is treating support or resistance as an exact line.
Financial markets do not always react at one precise price.
Instead of thinking:
"Resistance is exactly 1.1000."
it may be more useful to think of a resistance zone around that area.
Price can move slightly above or below a level before changing direction.
The same principle applies to support.
Thinking in zones can help traders avoid assuming that a level has automatically failed simply because price moved slightly beyond a single line.
What Is a Breakout?
A breakout occurs when price moves through an established support or resistance area.
For example:
If price repeatedly struggles below resistance and eventually moves strongly above it, traders may describe this as a bullish breakout.
If price moves below an important support area, traders may describe it as a bearish breakout.
Breakouts can sometimes indicate that the previous balance between buyers and sellers has changed.
However, not every breakout continues in the direction of the initial move.
What Is a False Breakout?
Sometimes price moves through support or resistance and then quickly returns to the previous range.
This is commonly referred to as a false breakout or failed breakout.
For example:
RESISTANCE → PRICE BREAKS ABOVE → PRICE FAILS TO CONTINUE → PRICE RETURNS BELOW
This is one reason traders should avoid assuming that every level break automatically means price will continue moving in the same direction.
Traders may consider factors such as:
- How strongly price broke the area
- How the candle closed
- What the broader market structure shows
- Higher-timeframe direction
- Current volatility
- Important economic events
Market context remains important.
Support Can Become Resistance
An important price-action concept is known as role reversal.
A previous support area may sometimes become resistance after price breaks below it.
Likewise, previous resistance may sometimes become support after price breaks above it.
For example:
RESISTANCE → BREAKOUT ABOVE → PRICE RETURNS → OLD RESISTANCE MAY ACT AS SUPPORT
Traders sometimes refer to this sequence as a breakout and retest.
The opposite can also occur:
SUPPORT → BREAKOUT BELOW → PRICE RETURNS → OLD SUPPORT MAY ACT AS RESISTANCE
However, a retest does not always occur, and a previous level does not always successfully change roles.
Support and Resistance Within Market Structure
Support and resistance become more useful when viewed as part of the broader market structure.
Instead of looking at one level in isolation, traders may consider:
- Whether the market is trending or ranging
- Previous highs and lows
- Higher highs and higher lows
- Lower highs and lower lows
- Areas where structure has broken
- The location of price within the broader range
For example, a support area forming within a broader uptrend may have different context from the same-looking support area inside a strong downtrend.
Location matters.
Use Multiple Timeframes
Support and resistance can appear differently depending on the timeframe being analysed.
For example, traders may study:
- M15 — 15-minute chart
- H1 — 1-hour chart
- H4 — 4-hour chart
- D1 — Daily chart
An area that appears significant on a lower timeframe may exist inside a much larger structure visible on a higher timeframe.
Traders often use higher timeframes to understand broader market structure before using lower timeframes for more detailed analysis.
This does not mean higher-timeframe levels are guaranteed to hold.
Support, Resistance and Candlesticks
Candlestick behaviour can provide additional information when price reaches an important area.
For example, traders may watch for:
- Long upper or lower wicks
- Bullish or bearish engulfing candles
- Doji candles
- Strong momentum candles
- Repeated rejection
However, candlestick patterns should not automatically be treated as BUY or SELL signals.
A candlestick becomes more meaningful when considered together with location, market structure and broader context.
Don't Use Support & Resistance Alone
Support and resistance do not predict the future.
Traders may combine these areas with other forms of analysis, including:
- Market structure
- Trend direction
- Candlestick behaviour
- Price action
- Multiple timeframes
- Economic events
- Broader market conditions
- Risk management
The goal is to build context rather than depend on a single line on a chart.
A support level is not automatically a BUY.
A resistance level is not automatically a SELL.
Always Think About Risk
Even a strong-looking support or resistance area can fail.
Before entering any trade, traders should consider:
- Why am I considering this trade?
- Where is my planned entry?
- Where does my trading idea become invalid?
- Where would my Stop Loss be placed?
- How much capital would be at risk?
- What position size would I use?
- What is the potential reward relative to the risk?
Technical analysis cannot guarantee a profitable outcome.
The purpose of identifying support and resistance is to provide structure to analysis — not certainty.
Common Beginner Mistakes
When learning support and resistance, beginners should be careful of common mistakes such as:
- Drawing too many levels on the chart
- Treating every previous high or low as important
- Expecting price to react at one exact number
- Buying every support area automatically
- Selling every resistance area automatically
- Assuming every breakout will continue
- Ignoring higher-timeframe structure
- Ignoring risk management
A cleaner chart with a smaller number of meaningful areas can often be easier to analyse than a chart covered with dozens of lines.
Learn Price Action with MKFX
Support and resistance form part of the price-action and technical-analysis concepts covered through the MKFX Academy.
The MKFX ecosystem brings together:
- MKFX Academy — structured trading education
- Educational Trading Signals — trade ideas members can study and review
- Market Analysis — technical observations, market context and possible scenarios
- Trading Journal — record and review trading activity
- Community — connect with other MKFX members
- Live Sessions — available according to membership access
Instead of simply showing members charts and signals, our goal is to help traders understand the concepts behind market analysis.
When a possible trading opportunity appears, members should be able to ask more than:
"Is this a BUY or SELL?"
They should also begin asking:
- Where is price within the broader structure?
- Where are the important support and resistance zones?
- Has price rejected or broken the area?
- What does the higher timeframe show?
- What would invalidate the trading idea?
- How much risk would be involved?
Understand the Structure
Support and resistance are foundational concepts, but they become more useful when combined with market structure, price action and disciplined risk management.
Do not search for a perfect line that predicts exactly where price must reverse.
Instead, learn to identify important areas, observe how price behaves around them and understand when the market is showing something different from your original expectation.
LEARN THE MARKET.
ANALYZE THE STRUCTURE.
MANAGE THE RISK.
GROW YOUR KNOWLEDGE.
MKFX
LEARN. ANALYZE. GROW.
Powered by MKTECHSUPPORT (PTY) LTD
Risk Disclaimer: Trading involves significant risk and losses are possible. Support and resistance zones, breakouts, retests, candlestick patterns and other forms of technical analysis do not guarantee future market movements or profitable results. MKFX provides trading education, market insights, educational trading signals and related tools. Nothing contained in this article constitutes personalised financial advice or guarantees trading results.