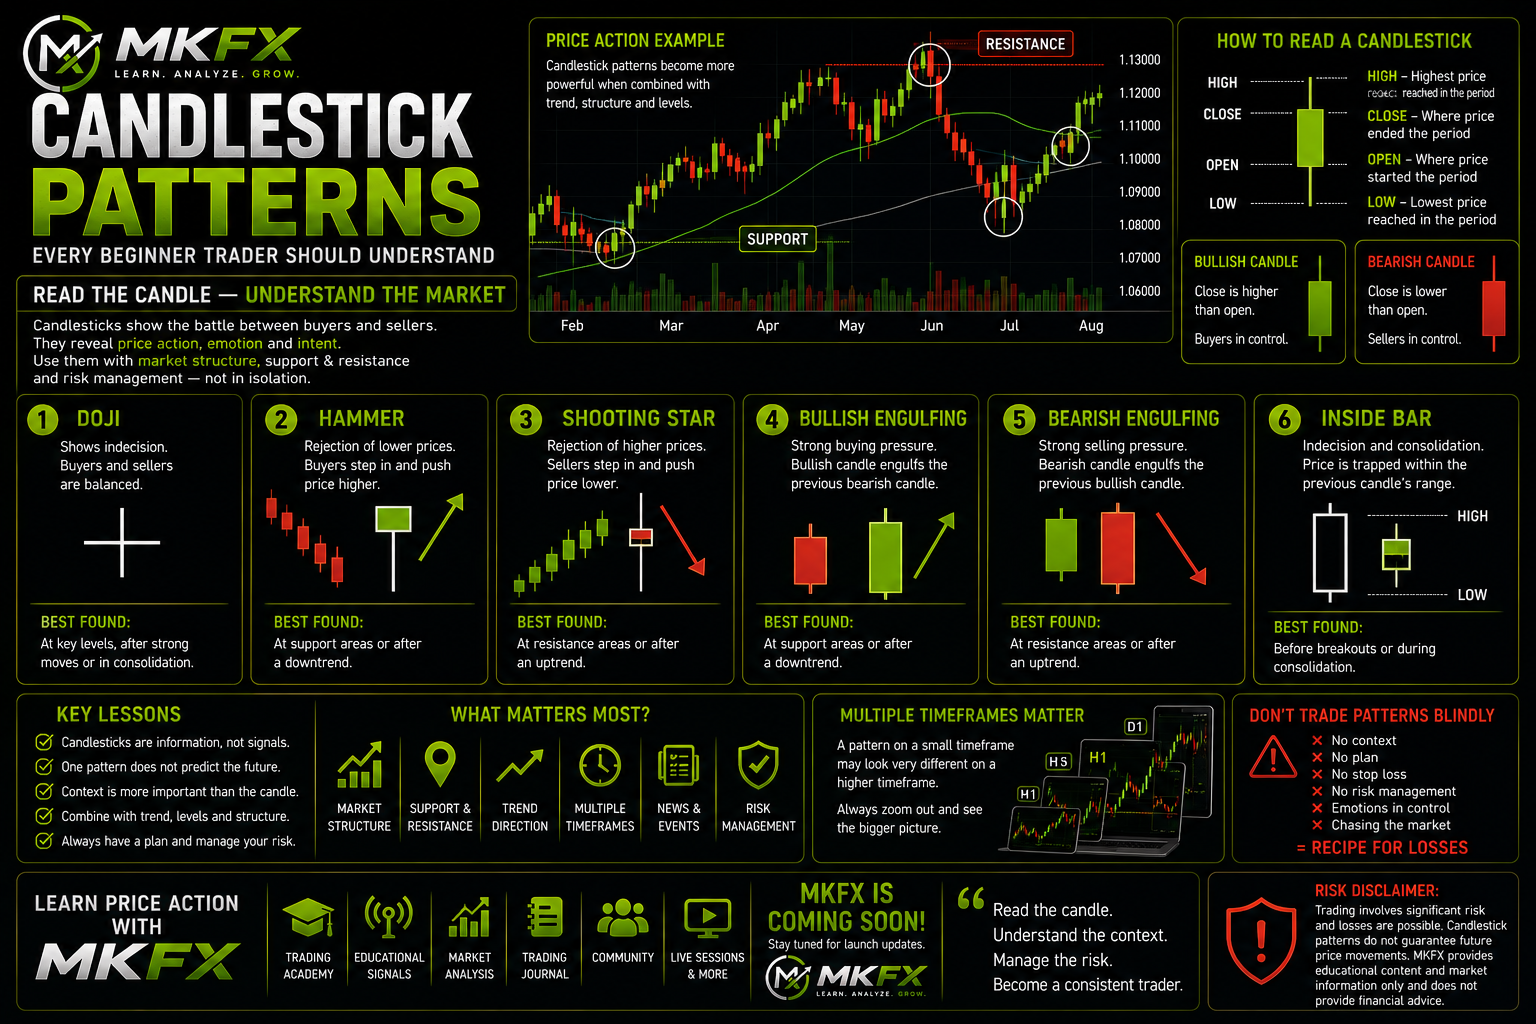
Candlestick Patterns Every Beginner Trader Should Understand
Candlestick charts are one of the most common ways traders view and analyse price movements.
Each candle provides information about what happened during a specific period of time.
But candlesticks should not simply be memorised as BUY or SELL signals.
The real value comes from understanding what the candles are showing about price behaviour and combining that information with the broader market context.
What Does a Candlestick Show?
Every candlestick contains four important prices:
- OPEN — where the period started
- HIGH — the highest price reached
- LOW — the lowest price reached
- CLOSE — where the period ended
Together, these values form the candle's body and wicks.
The body shows the relationship between the opening and closing prices, while the wicks show how far price travelled above or below the body during that period.
Bullish Candles
A bullish candle generally forms when the closing price is above the opening price.
OPEN → PRICE MOVES HIGHER → CLOSE ABOVE OPEN
This shows that buyers were able to push price higher during that particular period.
However, one bullish candle does not automatically mean that the market will continue moving higher.
Bearish Candles
A bearish candle generally forms when the closing price is below the opening price.
OPEN → PRICE MOVES LOWER → CLOSE BELOW OPEN
This shows that sellers were able to push price lower during that particular period.
Just like a bullish candle, one bearish candle alone does not determine what the market will do next.
What Do Wicks Tell Us?
The thin lines extending above or below the candle body are commonly called wicks or shadows.
A long upper wick can show that price moved higher during the period but was pushed back down before the candle closed.
A long lower wick can show that price moved lower but recovered before the candle closed.
Wicks can therefore provide useful information about:
- Price rejection
- Buying or selling pressure
- Volatility
- Areas where price struggled to continue
However, a wick alone does not tell you what price will do next.
1. Doji
A Doji forms when the opening and closing prices are the same or very close together.
It can represent a period where neither buyers nor sellers established clear control by the close of the candle.
A Doji can become more meaningful when considered together with:
- Market trend
- Support and resistance
- Previous candles
- Market structure
- Volatility
- Higher-timeframe context
A Doji should not automatically be treated as a reversal signal.
2. Hammer
A Hammer typically has:
- A relatively small real body
- A long lower wick
- Little or limited upper wick
When a Hammer appears after downward price movement, traders may watch it as evidence that lower prices were rejected during that period.
Price moved lower, but buyers were able to push it back upward before the candle closed.
However, the appearance of a Hammer does not guarantee that the market will reverse.
Its location and surrounding market structure remain important.
3. Shooting Star
A Shooting Star typically has:
- A relatively small real body
- A long upper wick
- Little or limited lower wick
When appearing after upward price movement, it can show that price moved higher but was rejected before the candle closed.
This may attract attention from traders looking for evidence of selling pressure.
However, higher-price rejection does not guarantee that price will reverse.
4. Bullish Engulfing
A Bullish Engulfing pattern generally involves a bullish candle whose real body covers or "engulfs" the previous bearish candle's real body.
Traders may interpret this as evidence of increased buying pressure during that period.
The pattern may receive more attention when it forms:
- Around an important support area
- After downward price movement
- Near a previous market low
- At an area already identified through broader analysis
Even with these conditions, the pattern does not guarantee that price will continue higher.
5. Bearish Engulfing
A Bearish Engulfing pattern is generally the opposite of a Bullish Engulfing pattern.
A bearish candle's real body covers or engulfs the previous bullish candle's real body.
This can indicate increased selling pressure during that period.
Traders may pay closer attention when the pattern appears:
- Around resistance
- After upward price movement
- Near a previous market high
- At an area identified through broader market analysis
Again, the surrounding market structure matters.
6. Inside Bar
An Inside Bar forms when a candle's high and low remain within the range of the previous candle.
It can represent a period of consolidation or reduced volatility relative to the previous candle.
Traders sometimes monitor the range for a possible future breakout.
However, the direction of that breakout is not guaranteed.
Price may break upward, downward or produce a false breakout before changing direction.
Context Is More Important Than the Pattern
This is one of the most important concepts beginner traders should understand.
Imagine seeing a Hammer on your chart.
Does that automatically mean BUY?
No.
A trader might also consider:
- Is price near an important support area?
- What is the overall trend?
- What happened before the candle formed?
- What does the current market structure show?
- Is the market trending or ranging?
- Is important economic news approaching?
- What does the higher timeframe show?
- Where would the trading idea become invalid?
- How much risk would be involved?
The same candlestick pattern can have very different significance depending on where and when it forms.
Understanding Multiple Timeframes
Candlesticks represent different periods depending on the chart timeframe being viewed.
For example:
- M5 — 5 minutes
- M15 — 15 minutes
- H1 — 1 hour
- H4 — 4 hours
- D1 — 1 day
A pattern visible on a five-minute chart may exist inside a completely different structure on a four-hour or daily chart.
For example, a bullish pattern on M5 could appear while the broader H4 market structure remains bearish.
This is one reason traders often analyse more than one timeframe when developing a market view.
Don't Trade Candlestick Patterns Blindly
Memorising dozens of candlestick names does not automatically make someone a better trader.
Instead of asking only:
"What is the name of this pattern?"
Consider asking:
- Who appears to be controlling price?
- Where is rejection happening?
- Where are buyers responding?
- Where are sellers responding?
- What is the broader market structure?
- Where are support and resistance?
- What happened before this candle formed?
- What would invalidate the trading idea?
- What is my risk if I'm wrong?
Candlesticks provide information. They do not predict the future.
Candlesticks and Risk Management
Even a pattern that appears strong can fail.
This is why candlestick analysis should not replace risk management.
Before considering a trade, traders should think about:
- Position size
- Stop Loss placement
- Potential reward relative to risk
- Account exposure
- Current volatility
- Market conditions
A pattern should never be treated as a guarantee that makes risk management unnecessary.
Learn Price Action with MKFX
Candlestick analysis forms an important part of understanding price action and market structure.
Through the MKFX ecosystem, members can access:
- MKFX Academy — structured trading education
- Educational Trading Signals — trading ideas that can be studied and reviewed
- Market Analysis — market context, technical observations and possible scenarios
- Trading Journal — record and review your trading activity
- Community — engage with other MKFX members
- Live Sessions — available according to membership access
Price Action and Market Structure also form part of the broader educational direction of the MKFX Academy.
Our goal is to help traders understand why they are analysing a market rather than simply memorising BUY and SELL patterns.
Read the Candle. Understand the Context.
Candlestick patterns can provide useful information about what happened during a particular period, but they should be viewed as part of a larger market picture.
Study the candle.
Then study where it formed, what happened before it, what the broader market is doing and how much risk would be involved if your interpretation is wrong.
READ THE CANDLE.
UNDERSTAND THE CONTEXT.
MANAGE THE RISK.
MKFX
LEARN. ANALYZE. GROW.
Powered by MKTECHSUPPORT (PTY) LTD
Risk Disclaimer: Trading involves significant risk and losses are possible. Candlestick patterns, technical analysis and other forms of market analysis do not guarantee future price movements or profitable trading results. MKFX provides trading education, market insights, educational trading signals and related tools. Nothing contained in this article constitutes personalised financial advice or guarantees trading results.